
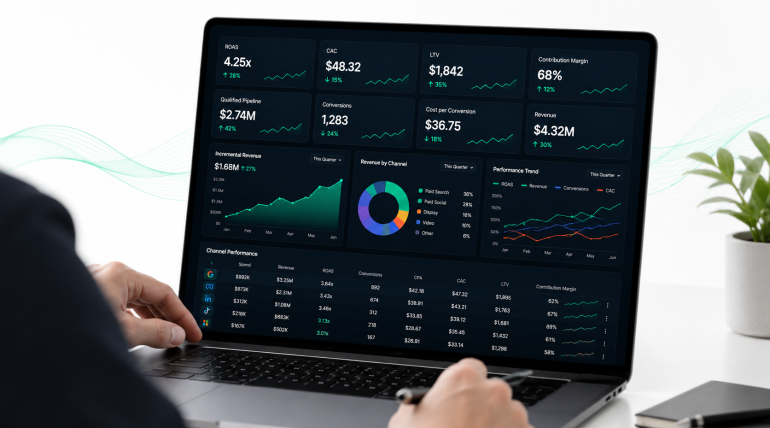
Why Your ROAS Is Lying to You: The Paid Advertising Metrics You Should Measure Before Scaling Spend
Have you ever presented a “4X ROAS” campaign to your leadership team, watched everyone nod in approval, and then quietly wondered whether the business was actually more profitable because of it?
You are not alone. Marketing dashboards are built to make ROAS look conclusive. A green arrow, a bold multiplier, a comparison to last month. But ROAS was never designed to answer the question leadership teams actually care about: is this spend making the business more money than it costs to generate it?
A campaign can post a 4X ROAS and still destroy margin. A campaign can post a 1.8X ROAS and still be the most profitable channel in the business. The number alone cannot tell you which one you are looking at.
That gap between what the dashboard shows and what the balance sheet reflects is where budgets get allocated on the wrong evidence.
The Metric That Was Never Built to Stand Alone
Return on ad spend measures revenue generated per dollar spent. Nothing more. It does not know your cost of goods sold, your payment processing fees, your fulfillment costs, or your team’s operating overhead.
According to 2026 industry benchmark data, the median return on ad spend across Google Ads campaigns sits at approximately 3.5 to 1, while the average across all industries and platforms runs higher at 5.3 to 1, a figure skewed upward by high margin sectors such as legal services and B2B software.
A business with a 30 percent profit margin needs roughly a 3.3X return just to break even on acquisition. Every point below that threshold is a loss disguised as a win.
The break-even math is straightforward: divide 1 by your gross margin. At a 50 percent margin, break-even sits at 2 to 1. At a 20 percent margin, break-even climbs to 5 to 1. That single calculation exposes why a “good ROAS” published in an industry benchmark report means almost nothing without your own margin structure sitting next to it. Category data illustrates the point starkly.
An electronics brand, for instance, often needs an 8X or higher return simply to break even, because thin hardware margins leave little room for acquisition cost.
Where CAC Enters the Conversation
Customer acquisition cost tells you what it costs, in absolute terms, to win one customer. ROAS tells you a ratio. Neither is complete without the other. A campaign with a strong ROAS can still carry a CAC that outpaces contribution margin on the first purchase, particularly in categories with long consideration cycles or high-touch sales processes common across UAE real estate, healthcare, and B2B services.
This is where customer lifetime value becomes the deciding factor. A subscription business or repeat-purchase retailer can absorb a CAC that looks alarming on a single transaction, because the second, third, and tenth purchase are where the profit lands. Broader benchmark analysis places the overall average ROAS across sectors at roughly 2.26 times spend, a directional figure that changes considerably once repeat purchase behaviour and margin profile are factored in.
Judging a campaign on first-touch ROAS alone, without weighing it against lifetime value, punishes exactly the campaigns that are building your most durable customer base.
The UAE Attribution Blind Spot Most Dashboards Miss
For businesses across the UAE and wider GCC, there is a structural problem layered on top of the margin issue: a meaningful share of the customer journey happens outside the platforms doing the measuring. WhatsApp is used by over 90 percent of UAE residents and remains the dominant channel for direct business inquiries, and the typical UAE consumer journey moves from discovery on Instagram or TikTok, to validation on Google, to closing the sale on WhatsApp.
A platform dashboard attributing revenue purely to the click that started that journey is structurally blind to the channel that finished it.
Marketing technology analysts point to a specific mechanism behind this blind spot. The most common reason click-to-WhatsApp campaigns underperform on paper is missing conversion attribution, because the advertising platform can see that a WhatsApp conversation started but cannot natively see whether it ended in a completed sale, a qualified lead, or an abandoned chat.
A campaign judged solely on last-click platform data can appear to underperform while it is quietly driving a large share of qualified pipeline through a channel the dashboard cannot see. For leadership teams working from platform reporting alone, this blind spot is not a rounding error. It can be the difference between defunding your best channel and scaling your worst one.
What Leadership Teams Should Actually Measure Before Scaling Spend
Before increasing budget on an apparently successful campaign, run it through four checks rather than one. First, calculate your break-even ROAS using your actual gross margin, not an industry average. Second, compare CAC against contribution margin on the first transaction, then against projected lifetime value.
Third, reconcile platform-attributed revenue against closed deals in your CRM, particularly for journeys that pass through WhatsApp. Fourth, isolate incremental revenue, the portion of sales that would not have happened without the campaign, rather than sales the platform simply claims credit for.
This is the foundation of “Business Before Marketing.” A dashboard metric that looks impressive in a slide deck is not the same as a financial outcome that strengthens the business. Accountability before activity means every dirham of ad spend earns its place based on what it contributed, not what the platform reported.
The Real Question Before You Scale
ROAS is not wrong. It is incomplete. Used alone, it rewards campaigns that look efficient on a screen and can quietly punish the ones building your most profitable, durable customer relationships. Before your next budget conversation, ask your team to bring contribution margin, CAC against lifetime value, and a reconciled view of where revenue actually closed, not just where it was first clicked. That is the evidence that should decide whether spend scales up or gets redirected.
If your business is ready to connect advertising performance to actual business outcomes rather than platform-reported wins, KAPLA’s Market Intelligence and Go-to-Market Strategy services are built to close exactly that gap.